It’s becoming traditional to start each episode with a plug, and this week’s one is for an event that takes place 22-27 June, 2015 in Nijmegen in the Netherlands. It’s the joint meeting of Mathematical Foundations of Programming Semantics (MFPS XXXI) and the 6th Conference on Algebra and Coalgebra in Computer Science (CALCO 2015). I’m co-chairing CALCO this year with Larry Moss, and we have some really fantastic papers and invited talks. Come along!
One of our invited speakers, Chris Heunen from the Quantum Group in Oxford, will talk about Frobenius monoids, which are a big part of graphical linear algebra, as we will see in a few episodes. I also have a paper at MFPS with my PhD student Apiwat Chantawibul in which we use the diagrammatic language of graphical linear algebra to study some extremely interesting and useful concepts of graph theory; I will probably write about this here at some point in the future.
Last time I—somewhat vaguely—claimed that there is a 1-1 correspondence between diagrams in our theory and matrices with natural number entries. In this episode we will start to discuss this correspondence properly.
First, though, we need to understand what matrices are exactly. And here I would argue that the definition given in Wikipedia (as of today, May 23, 2015) is not only overlong and boring, which is to be expected of our beloved internet creation, but actually wrong.
I quote:
“A matrix is a rectangular array of numbers or other mathematical objects”.
Well that tells part of the story, but ignores some hairy corner cases.
Our working definition is as follows. A matrix with natural number entries is an entity that consists of three things together: a natural number m that tells us how many columns there are, another natural number n that tells us how many rows there are and a n×m grid of natural numbers. We will write it as follows:
Here are three small examples.
Maybe you’re thinking that there is some redundancy here: I mean, if I give you a rectangular array can’t you just count the numbers of columns and rows to obtain the other two numbers? What’s the point of keeping this extra information around?
This is where the corner cases come in. Consider the following three matrices.
We are not good at drawing 15×0, 0×3 and 0×0 grids of natural numbers because they all end up looking a bit… empty. On the other hand, all three are usually used to represent different things, so it does not feel right to identify them. That’s why it’s useful to keep those two extra numbers around: they help us get around this small, yet important deficiency in the standard notation. There are other, more subtle deficiencies in matrix notation, and we will get around to exposing them in later episodes.
We define two operations on matrices, and they are quite similar to the operations on diagrams. The first is direct sum. Its action is governed by the rule
 where the grid A₁ ⊕ A₂ is defined as follows:
Note that I’m being slightly careless with the notation; in the diagram above the two 0s, reading from left to right, are respectively m₁×n₂ and m₂×n₁ grids that have 0s as all of their entries.
So, for instance,
and
Notice that, just as is the case for diagrams, direct sum is not commutative. It is associative though, given any matrices A, B, C the bracketing does not matter:
(A ⊕ B) ⊕ C = A ⊕ (B ⊕ C)
Here’s an example that illustrates why we need to keep the extra information about numbers of columns and rows:
So you see, that even though the number grid is empty in () : 3 → 0, you can certainly feel it when you direct sum it with something!
Here’s one final example.
Next we have the operation of composition, which is usually known by the name matrix multiplication.
Just as in diagrams, we can’t just multiply any two arbitrary matrices: you see that for composition to work, the number of rows of A has to be equal to the number of columns of B. Note also that the notational convention for the product is to write A after B even though we think of A as coming first, i.e. we wrote BA for the number grid part of the composition. If A and B were diagrams we would have written A ; B. It’s not a big deal, just a little notational quirk to keep in mind.
Now since BA is a grid of numbers, we need a way of figuring out its entries are. The formula that governs this is:
where (BA)ij refers to the entry in the ith row and the jth column. Don’t worry about memorising the formula, we have computers to do the calculations for us.
Using this formula it’s not too difficult to prove that matrix multiplication is associative, that is, for all matrices A, B, C that can be composed, we have
C(BA) = (CB)A
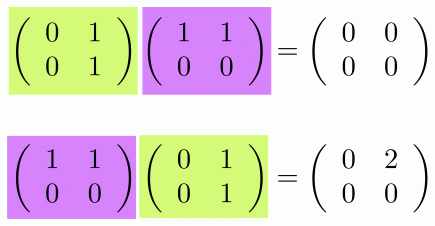
And, again just as we’ve seen in diagrams, matrix multiplication is not commutative. First of all, for most pairs of matrices it only makes sense to multiply them in one way, since the rows and columns have to match up properly. For square matrices, where the numbers of columns and rows are the same, we can find simple counterexamples to commutativity. Here is one:
 Are you missing diagrams already? I am. Let’s face it, grids of numbers are pretty dull. So just to scratch my itch, here are the two computations above, but illustrated as compositions of our diagrams.
How do we prove that our diagrams and matrices are interchangeable? To do so, we define a formal translation from diagrams to matrices. Since we will refer to it quite a bit, we may as well give it a name, say the Greek letter theta (θ). We can start defining θ by giving matrices for each of our generators. There are only four, so this is not very much work!
Next, we can use the observation that all of our diagrams can be subdivided so that we can write them as expressions that feature only the basic generators, identity and twist composed together with the two operations of diagrams ⊕ and ;. We demonstrated the procedure of how to get from a diagram to an expression for Crema di Mascarpone. Using this insight, the matrix for a composite diagram can be obtained by performing matrix operations on the matrices that are the translations of its subcomponents.
 The above definition is saying that in order to work out the matrix for the composition of diagrams A and B, first work out the matrices for A and B separately, and then multiply them. We can say something similar for direct sum.
Note that this is an example of a recursive definition: we use θ in the right hand side of the two definitions above. The reason why it makes sense is that eventually we get down to the generators, identity or twist, which are the base cases of the recursion. So the only thing that remains to explain is how to deal with the wiring:

A brief aside. A few episodes ago I claimed that it is hard to talk about copying using “traditional mathematical notation”. Since we just translated the copy generator into something that most scientists would recognise, haven’t I just contradicted myself?
I would argue that this translation does not really do copy justice: it has some hidden “baggage” in the sense that matrix algebra relies on how copy interacts with addition through equations (B1) through to (B4). It is sometimes useful to keep copy isolated, because it does not necessarily interact in the same way with other generators that may look quite similar to addition. I know that all of this sounds a bit mysterious, but bear with me. We will come back to this point later.
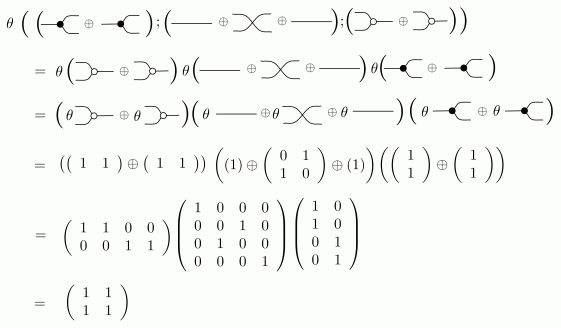
Let’s go through an example to get a feeling for how θ works: we will translate the right hand side of equation (B1) to a matrix. First, we decompose the diagram into an expression that features only the basic components.
Next we use the definition of θ for expressions to turn the right hand side of the above equation into an expression on matrices.
In the first two steps we simply used the defining equations for θ, first on composition then on direct sum. In the third step we used the definitions of θ on basic components, then we direct summed the matrices, and finally we computed the matrix product, using Wolfram Alpha.
So, summing up, we have worked out that:
But does this way of defining θ even make sense? The problem is that we have many different ways of writing a diagram as an expression. As we have seen in the last few episodes, sometimes we consider two diagrams that look quite different to be the same thing. So what if one way of writing it one way and applying θ gives you some matrix A, but writing a different expression for it and applying θ gives you a different matrix B? Then θ would not be well-defined, we could not be sure what the matrix that corresponds to any particular diagram really is.
But don’t worry, it’s all fine. There are three ways of obtaining different expressions for a diagram.
- We can subdivide the diagram in a different way. More on this in the next episode.
- We can use diagrammatic reasoning to stretch or tighten wires, or slide generators along wires.
- We can use our ten equations to replace components of diagrams.
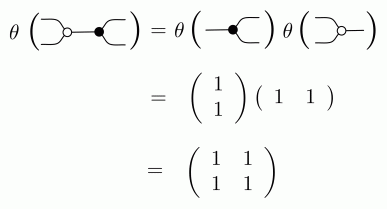
We can tackle point 3. easily enough. We just need to check that, for each equation in our system, the matrices that we get for the left hand side and the right hand side are the same. For example, to complete the job for (B1), in which we have already worked out the matrix for the right hand side, we just need to consider the left hand side.
So applying θ to the two sides of (B1) gives the same matrix. The same can be said for all of the other equations in our system: go ahead and check a few!
That leaves points 1. and 2. — can we be sure that diagrammatic reasoning will not change the matrix? And what if we choose to subdivide a diagram in a different way?
The reason why these issues do not cause problems is that both diagrams and matrices organise themselves as arrows of two different symmetric monoidal categories. And θ is not just any old translation, it is a functor, a way of getting from one category to another. Moreover, the two symmetric monoidal categories are both of a special kind: they are PROPs, which are symmetric monoidal categories with extra properties that makes them an ideal fit for graphical linear algebra.
We have lots of cool graphical linear algebra to do, and so I don’t want this series to descend into a discussion of the finer points of category theory . As I said back in episode 2, the amount of category theory that we really need is fairly modest. At this point we need just enough in order to understand points 1. and 2.
Moreover, we still need to understand in what way θ captures the close relationship between diagrams and matrices. We will show that θ is an isomorphism of categories, and more than that, an isomorphism of PROPs. Isomorphisms are quite rare in category theory, where a weaker notion called equivalence of categories is much more common. It goes to show just how closely our diagrams and matrices of natural numbers are related!
Continue reading with Episode 12 – Monoidal Categories and PROPs (Part 1)


inre empty matrices, cf. http:://ftp.cs.wisc.edu/Approx/empty.pdf in
LikeLike
erm, http://ftp.cs.wisc.edu/Approx/empty.pdf
LikeLiked by 1 person
Just a quick fix, you wrote “one way” twice:
I’m really loving the series by the way! Recommended it to quite a few people and classmates 🙂
LikeLike